Challenging SAT Math Problem Made Laughably Easy With Desmos

The SAT Practice test #6 poses quite a challenging problem in question #26 in module 1 (left). The problem provides us with a table of values for x and the corresponding function values on g(x). It is then stated that g(x) = f(x)/(x+3), where f is a linear function. Therefore, g is a composite function of f. Already, this question is getting confusing. Then, we are asked to find the y-intercept of the graph of y = f(x). The task of this problem adds to the complexity, and raises several questions initially:
“Should we try to find f(x)?”
”Is there a way to find the y-intercept of f(x), without explicitly solving for f(x)?”
”Can we use Desmos to help out here?”
It turns out that there is indeed an incredibly fast and intuitive solution using Desmos if you know a simple trick: regression fitting. Regression fitting allows us to determine a function explicitly, that matches a provided a table of values. Therefore, we will head to Desmos and enter a table of values. The following steps are also outlined below:
Click the ‘+’ at the top left, and then ‘table’. The columns will be labelled ‘x_1’ and ‘y_1’ by default, which is fine. Note that here, the underscore is used to indicate subscripts, which is exactly how it would be entered on Desmos as well. Enter in the table of values as I have shown in the image below. You will also notice the points being displayed in the x-y plane if you zoom out a bit.
We must define g(x) in a manner that will allow us to identify f(x) as a linear function. If we consider f(x) to have the form mx + b (the slope-intercept form of a linear function), therefore, g(x) takes the form (mx+b)/(x+3). However, we need Desmos to perform a regression which will identify the unknown variables ‘m’ and ‘b’. To do this, we must define the function in terms of our table of values, ‘x_1’ and ‘y_1’. The regression function is accessed using the ‘~’ (tilde) key in Desmos. We can therefore, enter ‘y_1 ~ (mx_1 + b) / (x_1 + 3)’ into the second entry of the expression list on the left-hand side, as shown below.
Desmos will find the ‘best match’ for the defined function to the table of values that was entered earlier. Desmos then presents the best fit regression parameters directly under the defined function. Here you can see that Desmos found m = 4, and b = 36. Therefore, our linear function f(x) takes the form f(x) = 4x + 36, and from our knowledge of linear functions, we know that b = 36 corresponds to y-intercept of (0, 36).
Therefore, we conclude that the answer to the problem is option A; (0, 36)! This process turned an otherwise tedious and rather challenging problem into a very quick, intuitive solution which could be completed in about 30 seconds once you get comfortable with the process. If you would like to see the algebraic solution, check out the explanations from the SAT College Board site, provided in the practice test #6 package: https://satsuite.collegeboard.org/practice/practice-tests/paper
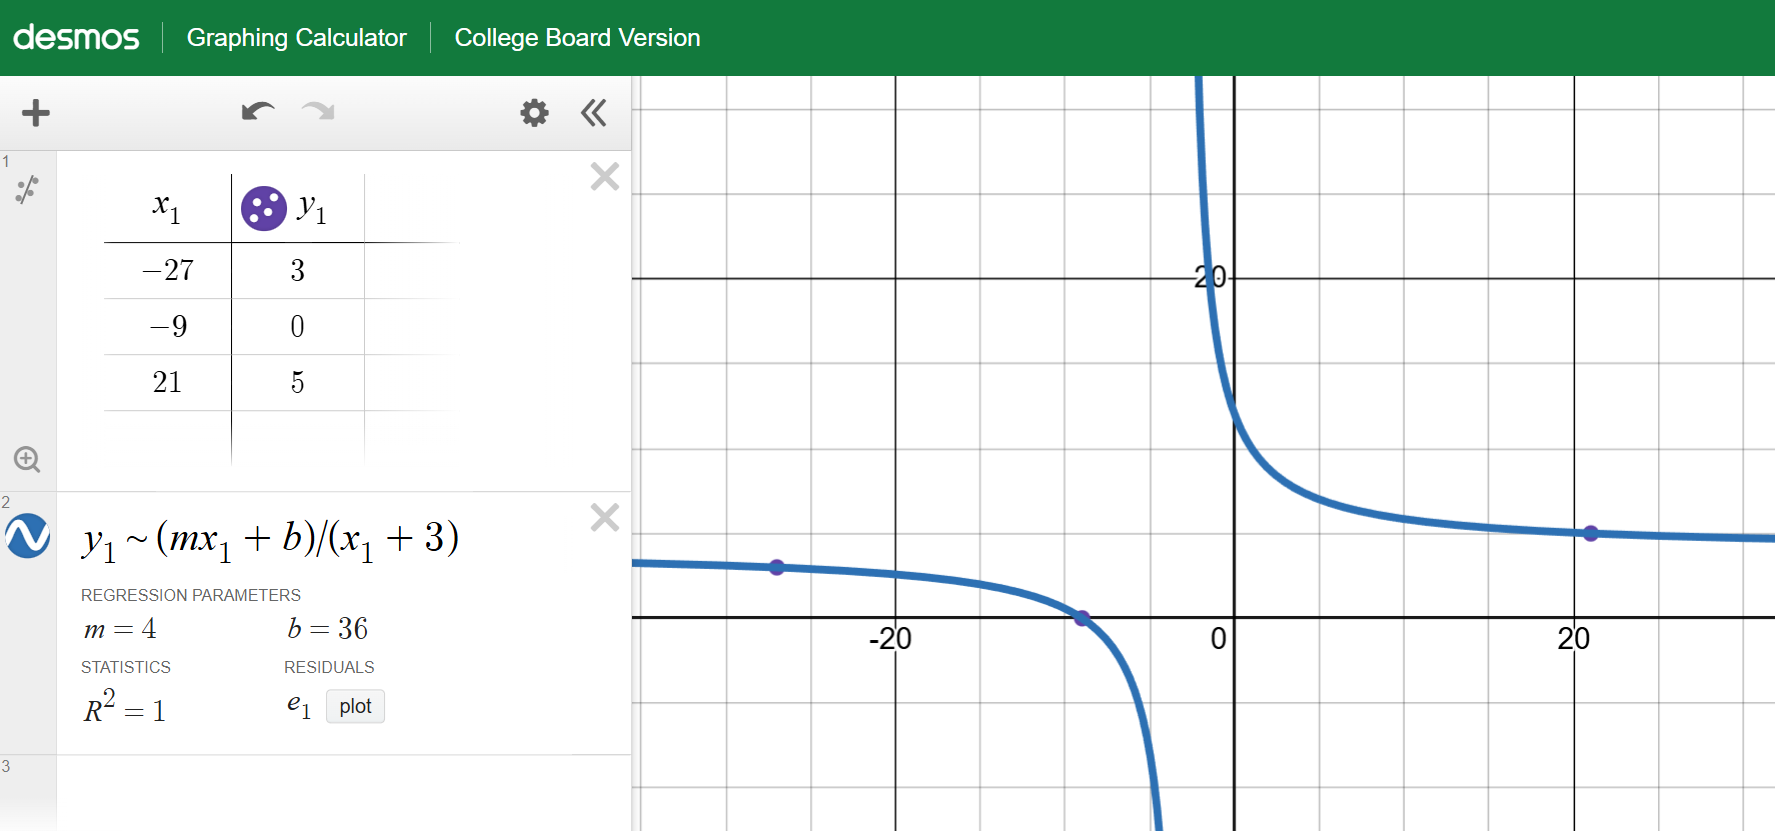
Desmos solution to SAT Math practice test #6, problem #26 in module 1, using regression fitting,
If you found this problem challenging and are wondering if there are other problems like this that can be solved rather quickly using Desmos, there are. This is just one of several techniques that we teach students to fully master the SAT math problems and to use their time efficiently. Check out our other blog posts for more SAT math tips, other math and education content, and consider reaching out if you would like extra help with your studies.